A digital home for the
Naughty Bawdy Brigade.
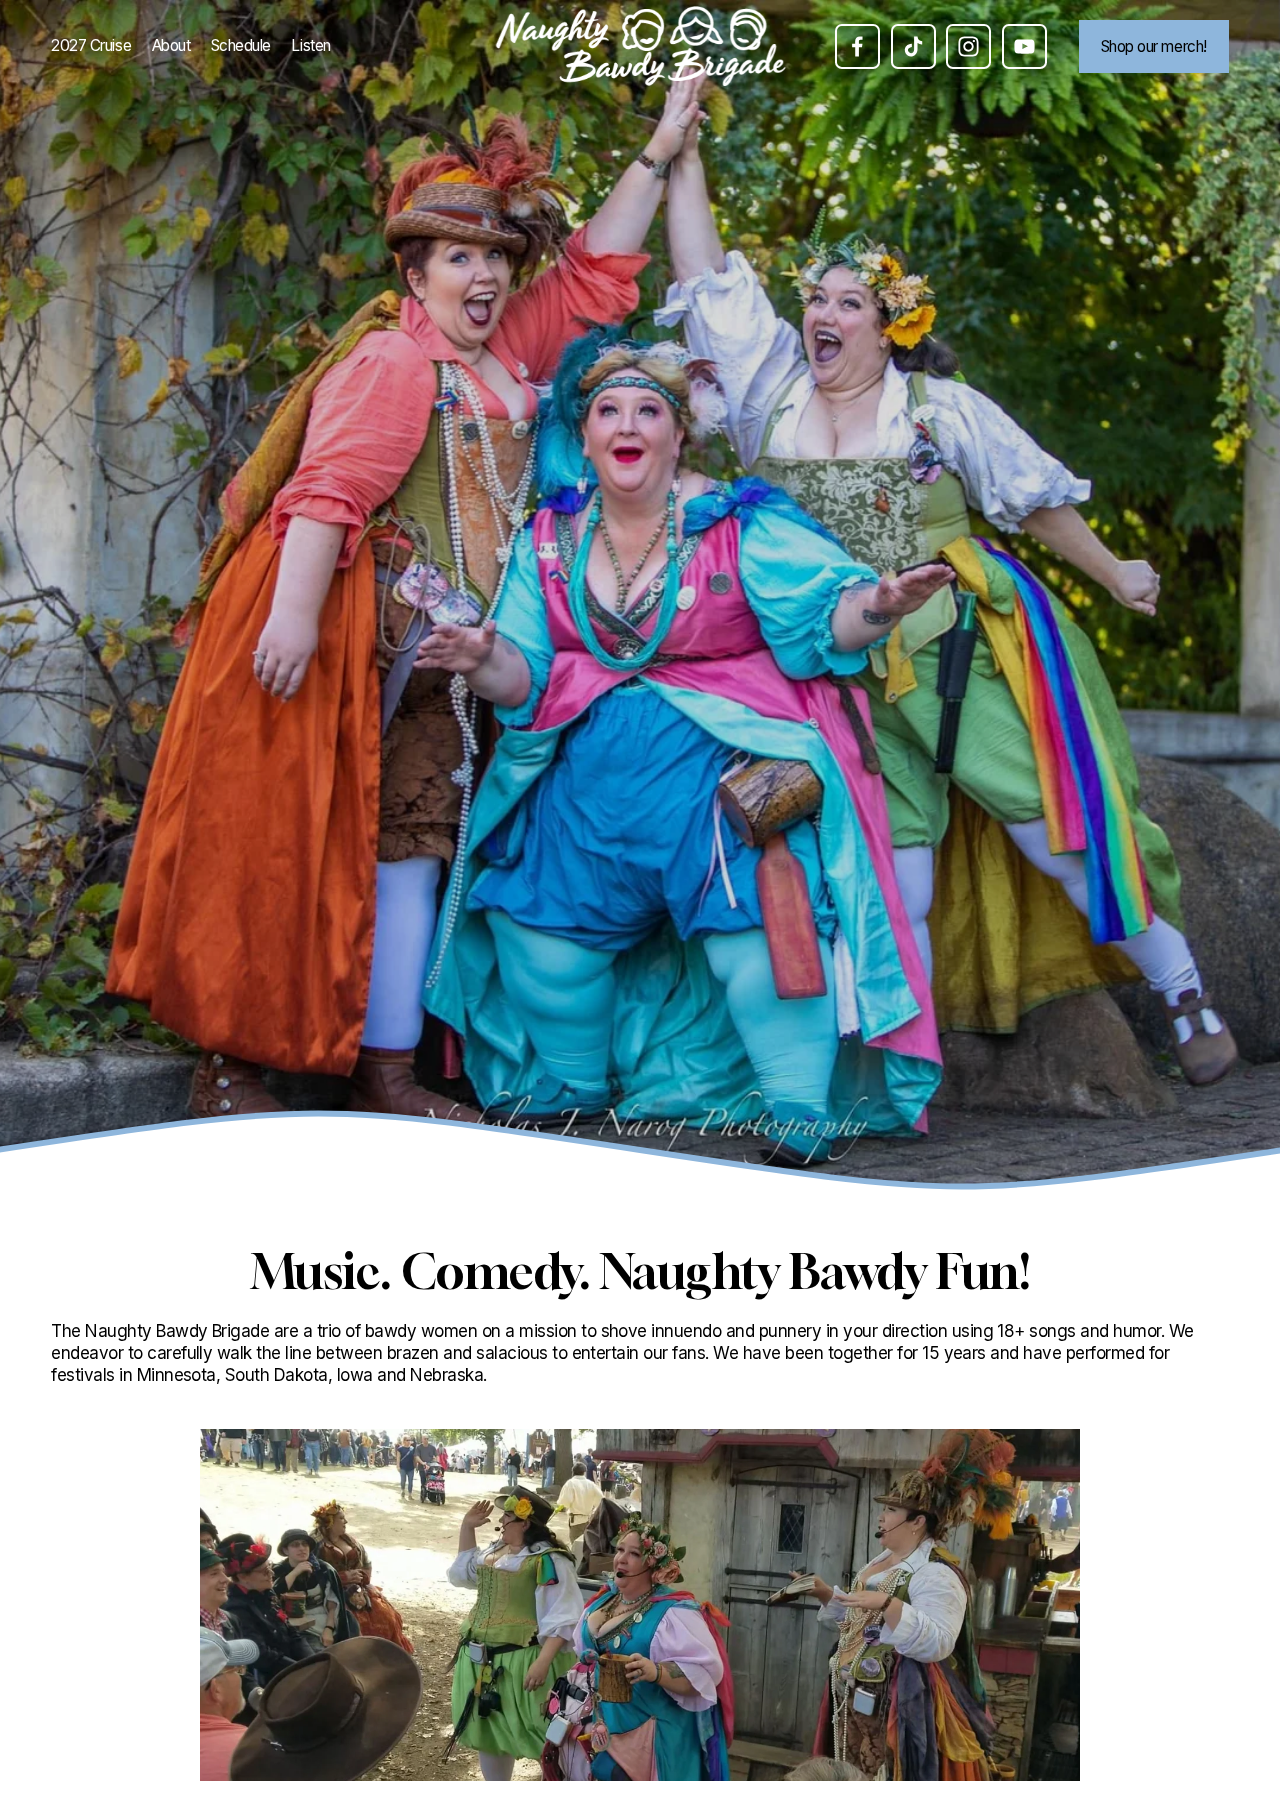
Turning an established stage presence into a website that helps fans find the next show—and stay connected between performances.
01 / The challenge
Known on stage.
Missing a home online.
The Naughty Bawdy Brigade had a performing group and a social media audience, but no website. Fans needed a place to find when and where we would perform, while the business needed to support merchandise sales and a performance tour cruise.
As an owner, I had strong ideas about what the site should contain. The challenge was to separate what I assumed fans needed from what they actually wanted.

Support tour cruise sales
Give the performance cruise a clear, easy-to-find destination.
Drive merchandise sales
Connect the audience to the group's merchandise shop.
Make the next show easy to find
Bring performance dates and locations into one place.
02 / Discovery
Start with questions,
not with screens.
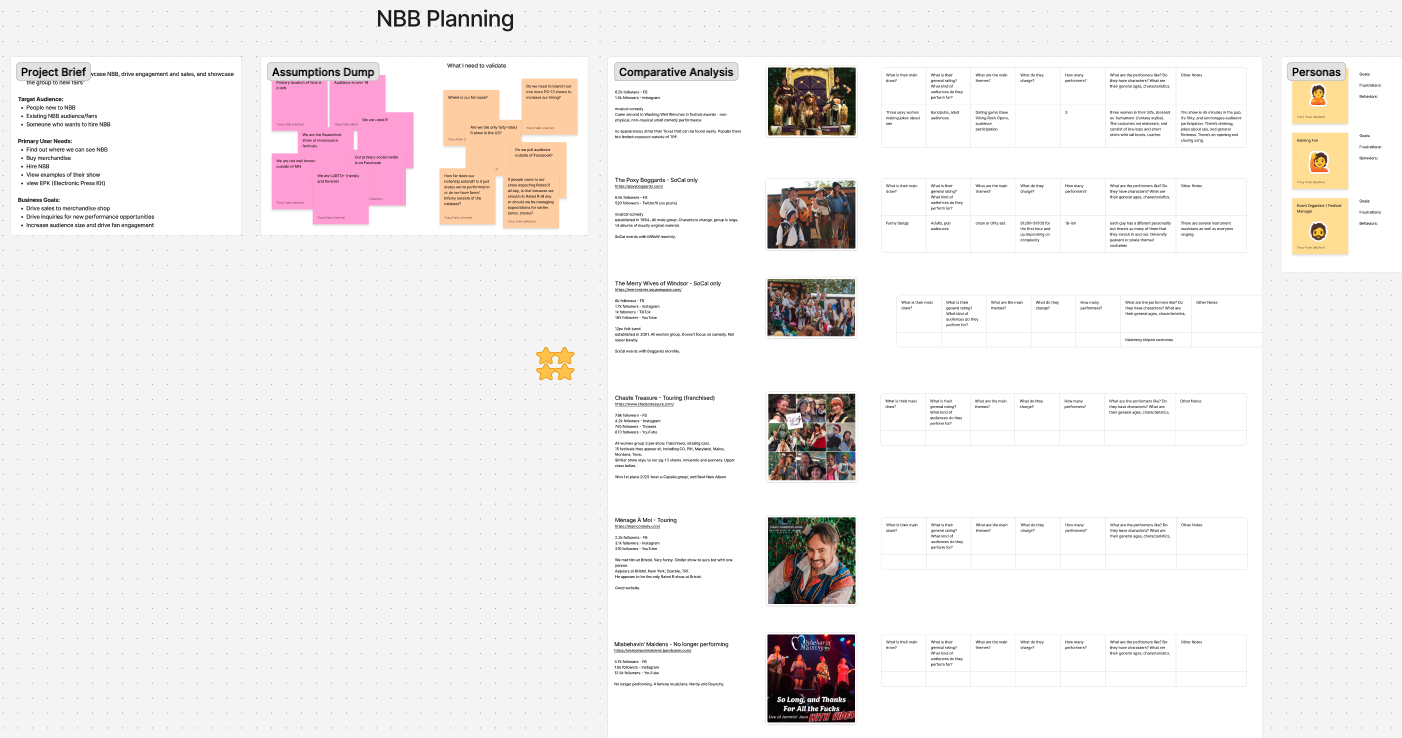
I used Figma to build a project brief, capture an assumptions dump, and whiteboard the problem. I then completed a comparative analysis of seven competing performing groups before reaching out to our social media audience.
Define the purpose
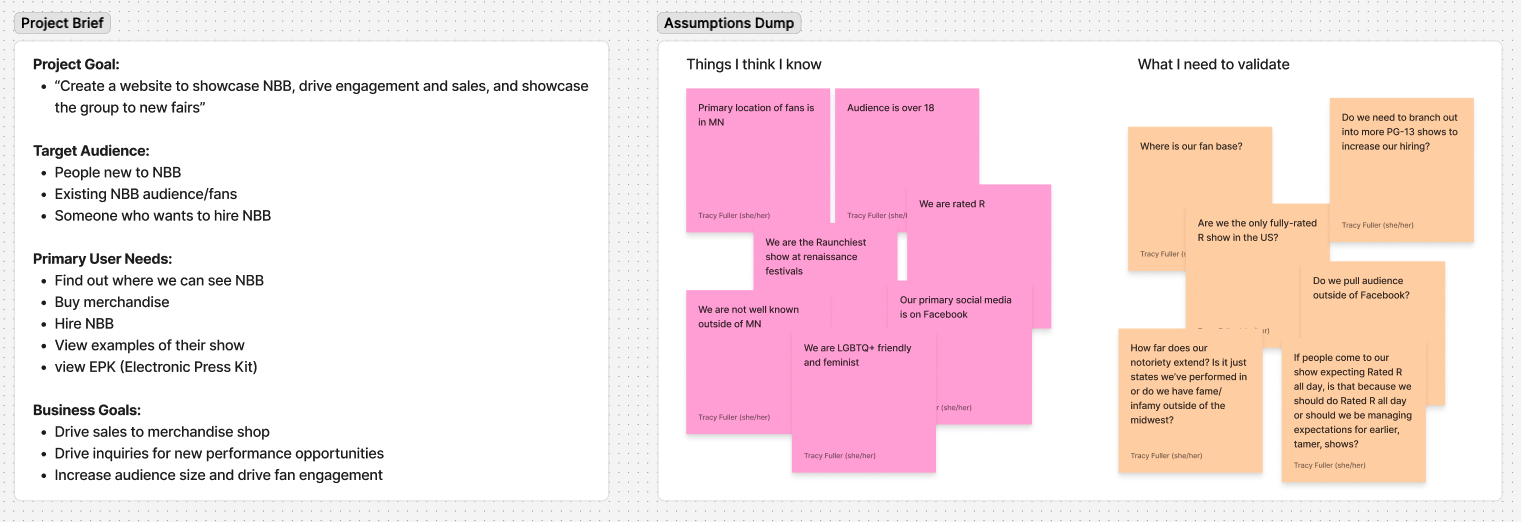
The project brief brought the three business goals together: cruise sales, merchandise sales, and performance discovery.
Make assumptions visible
Writing assumptions down created a starting point for the survey, rather than treating an owner's perspective as a substitute for audience feedback.
Look beyond our own group
The seven-group comparison provided context for the website exploration. The audience survey added direct input from the people who would use our site.
03 / Audience research
The audience made
the priorities clearer.
I shared a Google survey with our social media audience to test assumptions and understand what fans wanted from the first website. The supplied survey contains 20 responses.
75%
ranked show dates as their
number-one website priority
(15 of 20)
70%
would primarily visit
on their phone
(14 of 20)
70%
included a merchandise shop
in their top three priorities
(14 of 20)
What belonged in the top three?
Number of respondents who selected each item anywhere in their ranked top three.
Source: supplied audience survey. Top-three selections are not weighted scores. This small, self-selected sample represents existing followers, not all potential visitors: 18 of 20 had seen the group multiple times. Findings are directional, not proof of market-wide demand.
A website complements social—it doesn't replace it.
12 of 20 respondents would first check social media for upcoming shows; 8 would first look at the future website. That makes a consistent, easy-to-find schedule valuable across both channels.
04 / Research into design
Three goals.
Clear paths forward.
The finished website connects the business priorities to the audience's strongest needs. These are the visible paths on naughtybawdy.com.
Show discovery → A prominent schedule
Show dates were the clearest audience priority. The homepage includes upcoming performances and a “See Full Schedule” link, while Schedule has its own navigation entry.
View the scheduleCruise sales → A dedicated event page
The cruise has a top-level “2027 Cruise” navigation link and a dedicated page, giving this business priority a direct destination instead of burying it among other shows.
View the cruise pageMerchandise → A visible shop connection
A merchandise shop appeared in 14 respondents' top three. The site includes a “Shop our merch!” navigation button and homepage links that take visitors to the external store.
View the merchandise shopConnection → Introduce the performers
12 respondents included performer bios in their top three. “Meet the Mistresses” gives fans a way to get to know the people behind the performance.
05 / Outcome & reflection
From live audiences
to measurable impact.
+40%
Increase in cruise sales
After the website was created and QR codes were distributed at other shows to help audiences find more information.
The website gave the group its first central online home. QR codes connected our in-person audience to that destination, extending the experience beyond the stage and supporting the cruise sales goal.
Result reported by Tracy Fuller as a company owner. The increase followed the combined website and QR-code effort; it does not isolate the impact of the website alone. The comparison period and underlying sales counts are not included in this case study.
What I would measure next
Track QR-code visits through to cruise inquiries or bookings, outbound shop clicks and purchases, and visits to the full schedule. Merchandise growth and other conversion changes have not been measured here.
My biggest takeaway
Owning the company gave me context, but it also meant I needed to question my own assumptions. The survey made the strongest priority unmistakable: help fans find the next show. Research gave the website a clearer hierarchy, and QR-code outreach connected the live audience to its new online home.